
Multi-scale modeling of Arctic tundra vegetation requires characterization of the heterogeneous tundra landscape, which includes representation of distinct plant functional types (PFTs). In an article recently published in the journal Remote Sensing, PhD candidate Zachary Langford (ORNL) and others combined high-resolution multi-spectral remote sensing imagery from the WorldView-2 satellite and LiDAR-derived digital elevation models (DEMs) to characterize the tundra landscape around the Barrow Environmental Observatory (BEO). Vegetation surveys were conducted during the growing season (June–August) of 2012 from 48 plots in the study region for estimating the percent cover of PFTs (i.e., sedges, grasses, forbs, shrubs, lichens and mosses). Statistical relationships were developed between spectral and topographic characteristics and PFT fractions at the vegetation plots. These derived relationships were employed to upscale PFT fractions for our study region of 586 hectares at 0.25-m resolution. Zach and his colleagues employed an unsupervised clustering for stratification of this polygonal tundra landscape and used the clusters for segregating the field data for upscaling the algorithm over the study region, which was an inverse distance weighted (IDW) interpolation. These researchers describe two versions of PFT distribution maps upscaled by IDW from WorldView-2 imagery and LiDAR: (1) a version computed from a single image in the middle of the growing season; and (2) a version computed from multiple images through the growing season. This approach quantified the value of phenology for improving PFT distribution estimates. Zach and others evaluated the representativeness of the field surveys by measuring the Euclidean distance between every pixel. Ground-truthing indicated that including phenology had a better accuracy (R2=0.75, RMSE=9.94) than the single image (R2=0.63, RMSE=12.05) predicted from IDW. They also updated their approach to include the 24 ground-truthing plots and a second ground-truthing campaign in late August 2014 which indicated a better accuracy for the phenology model (R2=0.61 , RMSE=13.78) than only using the original 48 plots (R2=0.23 , RMSE=17.49). The authors suggest that the cluster-based IDW upscaling approach and the representativeness analysis offer new insights for upscaling high-resolution data in fragmented landscapes.
Reference:
Langford, Z., J. Kumar, F.M. Hoffman, R.J. Norby, S.D. Wullschleger, V.L. Sloan, C.M. Iversen. 2016. Mapping Arctic plant functional type distributions in the Barrow Environmental Observatory using WorldView-2 and LiDAR Datasets. Remote Sensing 8, 733. http://dx.doi.org/10.3390/rs8090733
[[{"fid":"188","view_mode":"default","type":"media","link_text":null,"attributes":{"title":"Figure 1. WorldView-2 true color image of our study region showing the estimated percent of wet tundra graminoids for Areas A, B, C, and D.","height":"615","width":"1430","class":"media-element file-default"}}]]
Figure 1. WorldView-2 true color image of our study region showing the estimated percent of wet tundra graminoids for Areas A, B, C, and D.
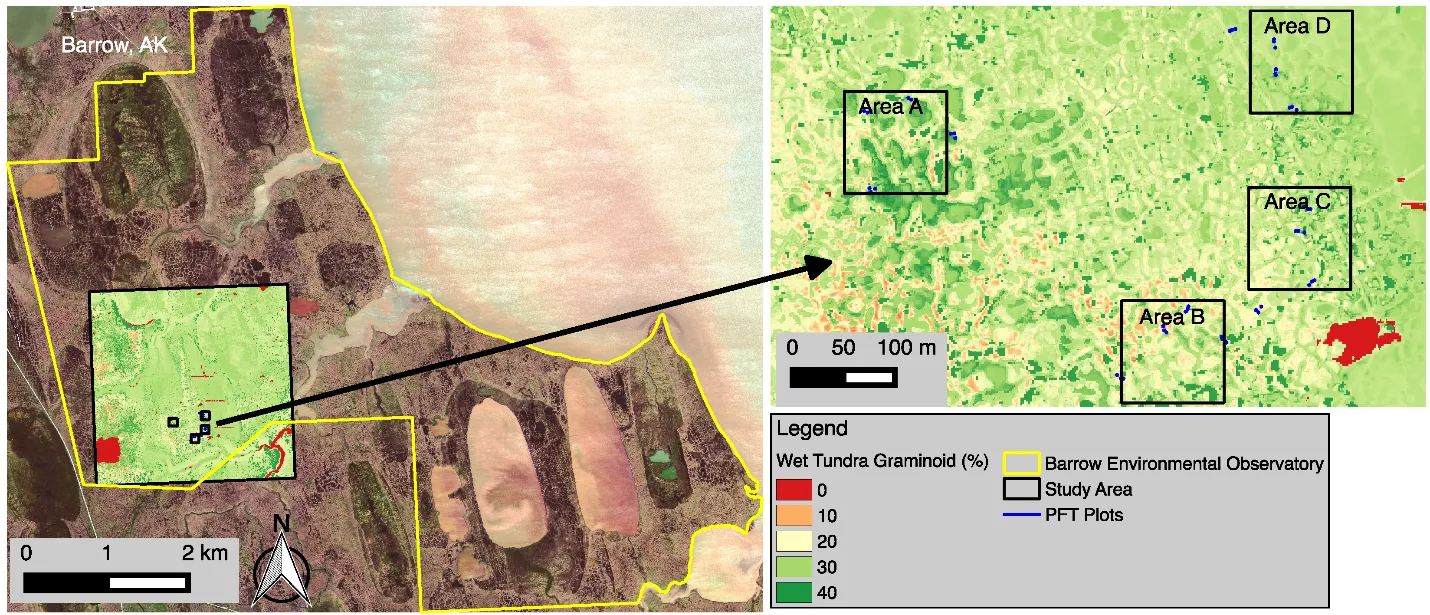
Figure 1. WorldView-2 true color image of our study region showing the estimated percent of wet tundra graminoids for Areas A, B, C, and D.
For more information, please contact:
Zachary Langford
langfordzl@ornl.gov