
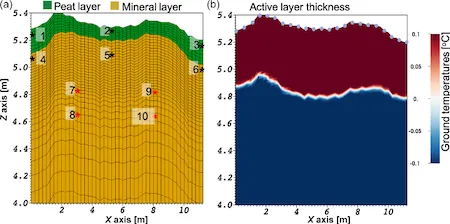
Improved parameterization of the subsurface properties in land system models would significantly enhance predictions and reduce modeling uncertainty. In this work, Elchin Jafarov (LANL) and his colleagues set the groundwork for future parameter estimation (PE) studies by developing and evaluating a joint PE algorithm that estimates soil porosities and thermal conductivities from time series of soil temperature and moisture measurements and discrete in-time electrical resistivity measurements. For the purpose of these numerical experiments, the computational mesh represents ice-wedge polygons studied by the NGEE Arctic team. The thickness of the parametrized peat layer corresponds to observations at the site, with a thick peat layer on the sides (troughs) and a thinner layer in the middle of the low-centered polygon. A mineral layer was assigned below the peat layer across the transect. The algorithm developed by this team utilizes the Model-Independent Parameter Estimation and Uncertainty Analysis toolbox and coupled hydrological-thermal-geophysical modeling. The PE algorithm was tested against synthetic data, providing a proof of concept for the approach. Jafarov and others used specified subsurface porosities and thermal conductivities and coupled models to set up a synthetic state, perturb the parameters, and then verify that their PE method can recover the parameters and synthetic state. To evaluate the accuracy and robustness of the approach they also performed multiple tests for a perturbed set of combinations of porosities and thermal conductivities. These numerical studies indicate that special care needs to be taken during field experiments so that (1) the vertical distance between adjacent measurement sensors allows the signal variability in space to be resolved and (2) the longer time interval between resistivity snapshots allows signal variability in time to be resolved.
Empty
For more information, please contact:
Elchin Jafarov