
Combining a data availability and needs analysis for parameters with qualitative causal loop analysis helps to identify parameters that are in most need of additional field data.
To address model uncertainty in Arctic ecosystem models caused by parameter uncertainty, the parameters of three models were investigated. The models used were SIPNET (Simplified Photosynthesis-Evapotranspiration model), ED2 (Ecosystem Demography Biosphere Model), and DVM-DOS-TEM (Dynamic Vegetation Dynamic Organic Soil Terrestrial Ecosystem Model), which have all been used for Arctic ecosystem modeling but represent a variety of complexities. Only 25% of parameters in SIPNET are available in ecological databases such as TRY (Plant Trait Database), BETY (Biofuel Ecophysiological Traits and Yield database), NGEE Arctic (Next-Generation Ecosystem Experiments Arctic data catalogue) and FRED (Fine-Root Ecology Database), and even fewer in the more complex models ED2 and TEM. To narrow the parameters that require additional field data and take structural uncertainty into account in addition to parameter uncertainty, a causal loop diagram of the Arctic was created. The diagram includes processes that are not represented in some of the models, which are mapped to the parameters in the models, thus allowing for network theory to be applied to the parameters. Variables that are linked with other parameters through several connections, some of which might not be explicitly modeled, are more vulnerable to change in the system. The higher the number of connections (NFFL), the higher the vulnerability in terms of the causal loop diagram, and the higher the need for field measurements. That number was then compared with the number of measurements for each parameter (NM), which allows for creating a ranking for which parameter groups are most in need of additional field data (see Figure 5). The parameter group highest in the ranking describes the impact of local temperature on microbial activity. This analysis was the groundwork for a model intercomparison and sensitivity analysis that is also being conducted.
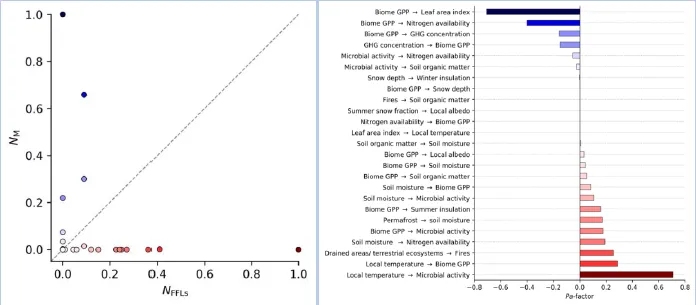
The normalized number of measurements against the normalized number of single and double feed forward loops.