
Permafrost thaw due to climate change is increasing greenhouse gas (CO2 and CH4) emissions from arctic soils. In polygonal ground, the magnitude and relative abundance of CO2 and CH4 release are influenced by redox conditions that vary across polygon features (i.e., trough, rim, and center), which are highly heterogenous and complex on small scales (10-30 m diameter). These small-scale features can be problematic to identify using satellite imagery, but their abundance and extent in the arctic must be accounted for in global climate models to accurately scale-up landscape emissions and predict carbon budgets. Therefore, this study tests a novel polygonal ground classification model to identify low-centered and high-centered polygons and differentiate them from non-polygonal ground in the arctic tundra. Here, we analyzed Worldview-3 (WV03) panchromatic (PAN) imagery of a study site (~2.25 km2) near the Barrow Environmental Observatory (BEO) on Alaska’s North Slope. Image textural features were calculated using gray-level co-occurrence matrices (GLCM) for an object-based image analysis (OBIA) approach suitable for very high-resolution imagery. GLCM features served as predictor variables for polygonal ground classification in a random forest machine learning algorithm. We determined that optimal classification occurs with GLCM displacement of 20.15 m, or about the scale of polygon features, and with gray quantization level of 64 levels. GLCM outputs at this scale and quantization level were distinct amongst high-centered polygons, low-centered polygons and various non-polygonal ground types and were used in a RF model to accurately differentiate regions of polygonal ground from non-polygonal ground. This approach is valuable for classifying different greenhouse gas-emitting landforms and can also be used to evaluate landscape change, e.g. degradation of low-centered polygons into high-centered polygons, as permafrost thaw progresses.
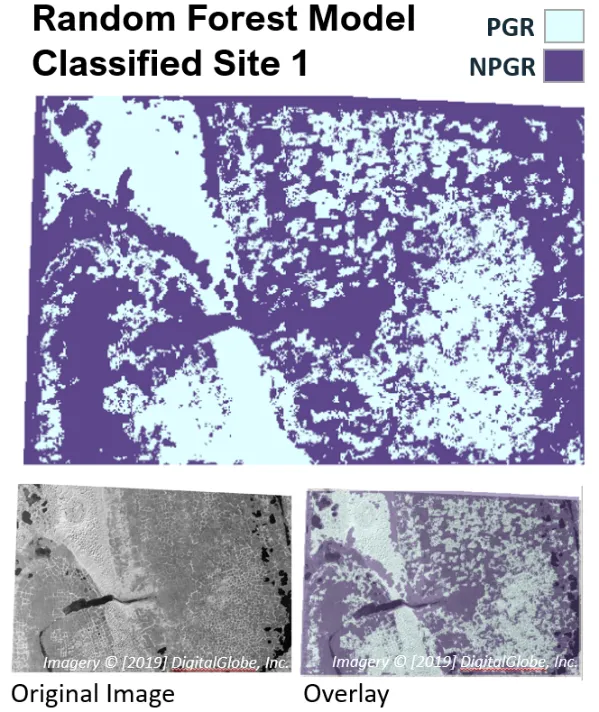
The raster image (below) is a classified map using the random forest model where GLCM contrast, homogeneity, dissimilarity, and entropy are used to predict NPGR (non-polygonal ground regions, purple) or PGR (polygonal ground regions, blue) with 92% overall accuracy.
For more information, please contact:
Elizabeth Herndon
herndonem@ornl.gov