
Estimating Permafrost Distribution and its Covariability with Landscape Characteristics
Combined temperature and electrical resistivity measurements show the distribution of permafrost and how it is related to topographic position and vegetation.
As climate warming is changing the Arctic landscape, both above- and below the surface, knowing where and how deep the ground is frozen is important to predict how the Arctic will change in the future. As subsurface boreholes with temperature data are sparse, innovative approaches combining various datasets are needed to get details about permafrost distribution.
Researchers measured the temperature and the electrical resistivity of the ground at NGEE Arctic study sites across the Seward Peninsula, Alaska, and used machine learning to estimate permafrost distribution across the landscape. Linking the properties of permafrost with observations above ground, the researchers showed that tall vegetation (>0.5 m) and gentle slopes (<15°) are generally associated with warmer and smaller permafrost bodies, and a more frequent occurrence of taliks (perennially unfrozen ground located within permafrost areas).
This study shows that a combination of temperature and electrical resistivity measurements can provide reliable estimates of the location and depth of permafrost. Knowing the co-variability among subsurface characteristics, topography, and vegetation is crucial to understand and predict how the Arctic will change in the future.
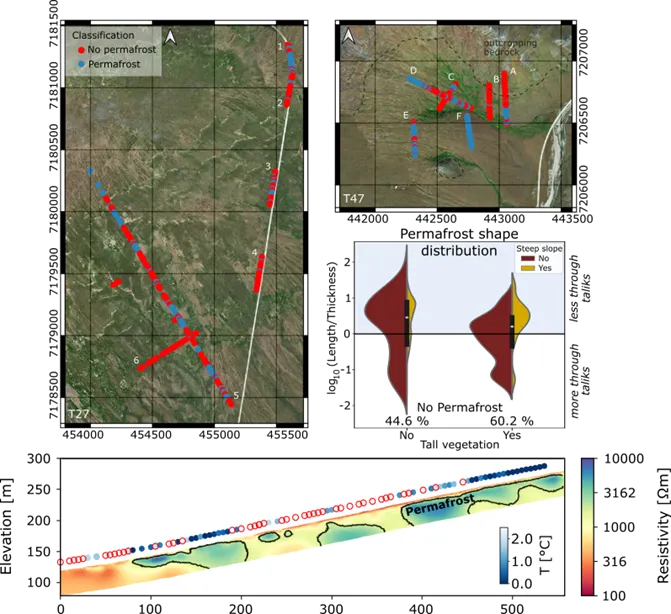
Estimated distribution of shallow permafrost (blue dots) across two of the three studied watersheds (top left and right), distribution of permafrost shape with varying vegetation cover and slope gradient (center right), and imaged shape of permafrost in the ground (bottom). Note: Red dots and circles denote presence of talik.
Uhlemann S, Shirley I, Wielandt S, Ulrich C, Wang C, Fiolleau S, Peterson J, Lamb J, Thaler E, Rowland J, Hubbard SS, Dafflon B. 2023. Estimating permafrost distribution using co-located temperature and electrical resistivity measurements. Geophysical Research Letters 50: e2023GL103987. https://doi.org/10.1029/2023GL103987
This research was supported by the Director, Office of Science, Office of Biological and Environmental Research of the US Department of Energy under Contract No. DE-AC02-05CH11231 as part of the Next-Generation Ecosystem Experiments (NGEE Arctic) project.