
The pathways and timing of drainage from inundated ice-wedge polygon centers in a warming climate have important implications for carbon flushing, advective heat transport, and transitions from carbon dioxide to methane dominated emissions. This research provides intuition on this process by presenting the first in-depth analysis of drainage from a single polygon based on fundamental hydrogeological principles. We use a recently developed analytical solution to provide a baseline for the effects of polygon aspect ratios (radius to thawed depth) and hydraulic conductivity anisotropy (horizontal to vertical hydraulic conductivity) on drainage pathways and temporal depletion of ponded water heights of inundated ice-wedge polygon centers. By varying the polygon aspect ratio, we evaluate the effect of polygon size (width), inter-annual increases in active layer thickness, and seasonal increases in thaw depth on drainage. One of the primary insights from the model is that most inundated ice-wedge polygon drainage occurs along an annular region of the polygon center near the rims. This implies that inundated polygons are most intensely flushed by drainage in an annular region along their horizontal periphery, with implications for transport of nutrients (such as dissolved organic carbon) and advection of heat towards ice wedge tops. The model indicates that polygons with large aspect ratios and high anisotropy will have the most distributed drainage. Polygons with large aspect ratio and low anisotropy will have their drainage most focused near their periphery and will drain most slowly. Polygons with small aspect ratio and high anisotropy will drain most quickly. Our results, based on idealized scenarios, provide a baseline for further research considering geometric and hydraulic complexities of ice-wedge polygons. This research was presented in the “Permafrost Systems in Transition: Interdisciplinary Approaches and Research Challenges II” session at the 2020 American Geophysical Fall Meeting (Presentation C018-02).
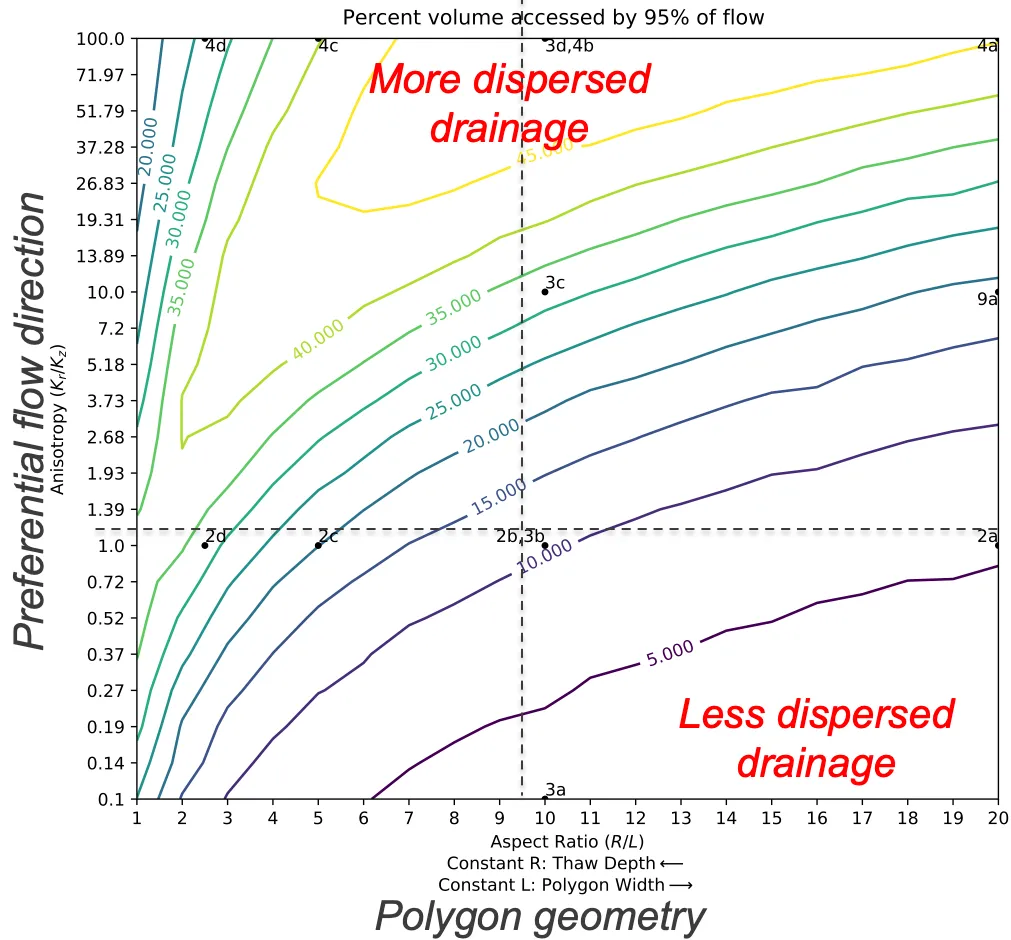
Contour map of the percent of the polygon thaw layer accessed by 95% of the flow as a function of polygon aspect ratio (radius/thaw depth) and hydraulic conductivity anisotropy (horizontal divided by vertical hydraulic conductivity).
For more information, please contact:
Dylan Harp
dharp@lanl.gov