
Causal loop diagram analysis can be a valuable tool in assessing structural- and parameter-based model uncertainty.
Climate change is having significant impacts on Earth's ecosystems and carbon budgets. In the Arctic, this may result in an historic shift from a net carbon sink to a source. Even small uncertainties in terrestrial biosphere models (TBMs) used to forecast the amount of carbon that may be sequestered or lost from Arctic ecosystems can propagate and significantly limit our ability to make adequate policy decisions. One of the most influential sources of model uncertainty is model parameterization. Parameter uncertainty results in part from a mismatch between available data in databases and model needs. We identified that mismatch for three TBMs, DVM-DOS-TEM, SIPNET, and ED2, and four databases with information on Arctic and boreal above- and belowground traits that may be applied to model parametrization. However, focusing solely on such data gaps can introduce biases towards simple models and ignores structural model uncertainty, another main source for model uncertainty. Therefore, we developed a causal loop diagram (CLD) of the Arctic and boreal ecosystem that includes unquantified, and thus unmodeled, processes. Combining model parameter- and structural-based uncertainty into one analysis improves our understanding of the strengths and weaknesses of each model. By employing ecological models of varying complexity, databases, and network methods, we identify the key parameters responsible for limited model accuracy. They should be prioritized for future data sampling to reduce model uncertainty.
Citation: Mevenkamp H, Wunderling N, Bhatt U, Carman T, Donges JF, Genet H, Serbin S, Winkelmann R, Euskirchen ES. 2023. Reducing uncertainty of high-latitude ecosystem models through identification of key parameters. Environmental Research Letters 18: 084032. https://doi.org/10.1088/1748-9326/ace637
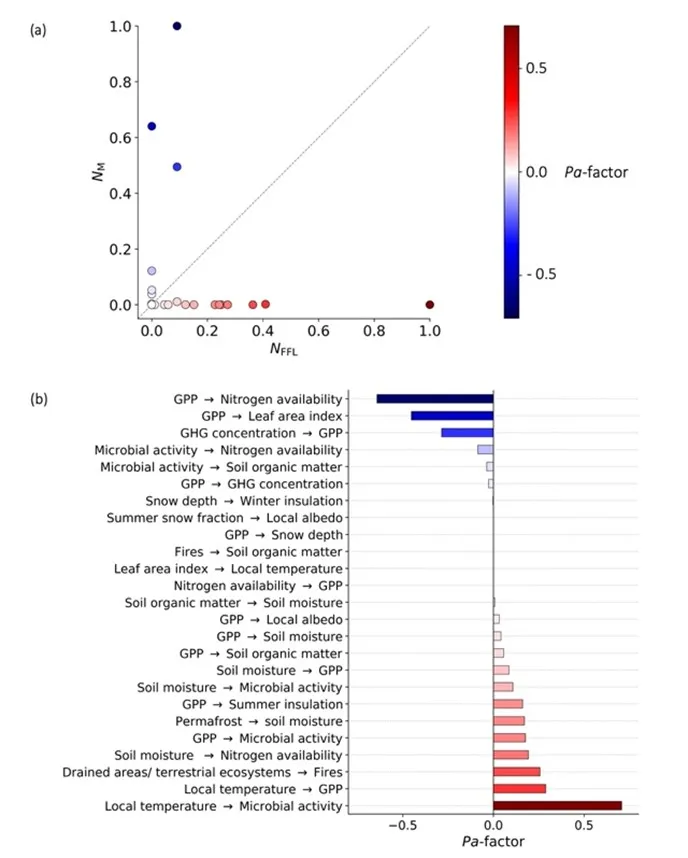
(a) Scatter plot of normalized number of measurements (NFFLs) compared with the normalized number of single and secondary feed forward loops (NM) for each model parameter group. (b) Pa-factor for each parameter group; a high positive value is a sign for a high need for additional measurements.
For more information, please contact:
Hannah Mevenkamp
hkmevenkamp@alaska.eduEugenie Euskirchen
seeuskirchen@alaska.edu