
Integrating aboveground PFTs with belowground biogeochemistry and gas fluxes.
Substantial progress has been made toward our understanding of how tundra plant and soil carbon cycling will respond to warming, but models remain uncertain, particularly with respect to mechanistic and variable biogeochemical responses to warming in soils with different PFTs. We conducted a field experiment near Council, Alaska, spanning upland tussock tundra with diverse PFTs growing in unsaturated soils to inundated thermokarst channels dominated by aerenchymous sedges. Our overarching objective was to mechanistically link soil gas fluxes (CO2, CH4, N2O) and soil biogeochemical variables (Fe2+, pH, redox, dissolved oxygen, and dissolved organic carbon) with PFT cover. These findings will help spatially resolve variability in arctic ecosystem responses to warming. We found considerable variability in belowground biogeochemistry between upland and lowland locations, and some variables were found to be correlated with soil greenhouse gas (GHG) fluxes. The lowland location emitted significantly greater quantities of CH4, and contained higher concentrations of dissolved Fe2+, indicative of Fe reduction. The upland areas were an overall soil GHG sink, whereas the lowland areas were an overall GHG source due to high CH4 fluxes. These findings will help improve our understanding of how climate change is altering the arctic carbon cycle. We plan to further integrate soil and gas data with plant and root data currently being collected from field samples.
Contact and email address: Sean Fettrow (fettrowsa@ornl.gov)
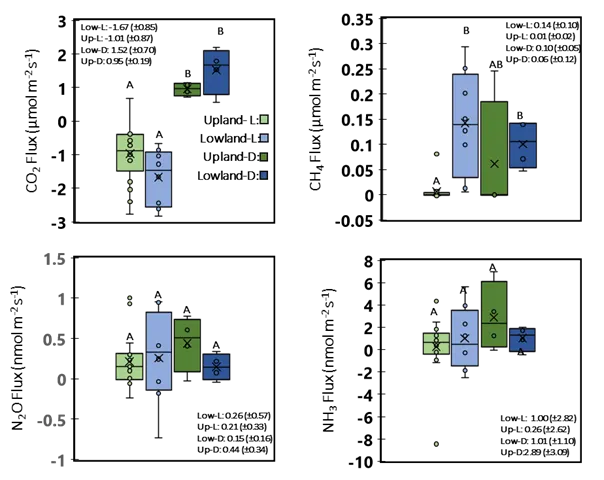
Box and whisker plot of gas flux measurements for CO2, CH4, N2O, and NH3. The × symbol represents the mean, the line represents the median, the bars represent the range, and the circles represent individual data points. Pale blue and green represent measurements taken under light conditions, whereas dark blue and green represent measurements taken under darkened conditions. Significant differences (P < 0.05) are indicated with letters from ANOVA tests for each gas flux. Means (± SD) are indicated for upland (up) and lowland (low) for both light (L) and dark (D) measurements.