
Ecosys, a process-rich terrestrial ecosystem model, reveals that watershed variability in soil temperatures, vegetation cover, and carbon fluxes is driven by near-surface hydrology and soil properties
At high latitudes, properties such as soil temperatures, vegetation cover, and carbon fluxes vary considerably across a landscape, hampering attempts to monitor, upscale, and predict ecosystem processes. However, the drivers of the observed landscape variability in these systems are still poorly understood. In this study, the team applied a Morris global sensitivity analysis to ecosys, a process-rich terrestrial ecosystem model, varying soil properties, boundary conditions, and weather forcing over ranges that represent the variability found in a watershed on the Seward Peninsula in Alaska. The team demonstrated that the observed variability in soil temperatures, vegetation composition, and carbon fluxes is driven by near-surface hydrology and soil properties. Snow depth, O-horizon thickness, and near-surface water content, which vary at scales of O(m), impact soil temperatures more than an air temperature gradient corresponding to a 140 km north-south distance. Tall shrub growth, which is an important indicator of change in the region, was only observed in simulations with perennially unfrozen soils that are neither too wet nor too dry. While simulated net carbon balance was generally low, simulations with a near-surface water table or tall shrub growth had high net carbon uptake. Using the results of the global sensitivity analysis, the team estimated that watershed net carbon uptake is 60% higher when the observed shrub distribution is considered. The tight couplings among water, heat, and carbon cycles identified by this work will help future efforts to monitor and predict ecosystem processes such as soil temperatures, shrub growth, and carbon fluxes at larger scales. These results highlight the complexity inherent in discontinuous permafrost environments and demonstrate that failure to account for small-scale variability in regional and global modeling efforts may lead to inaccurate and biased predictions.
Citation: Shirley, I. A., et al. 2022. “Near‐surface hydrology and soil properties drive heterogeneity in permafrost distribution, vegetation dynamics, and carbon cycling in a sub‐Arctic watershed.” Journal of Geophysical Research: Biogeosciences, e2022JG006864. https://doi.org/10.1029/2022JG006864.
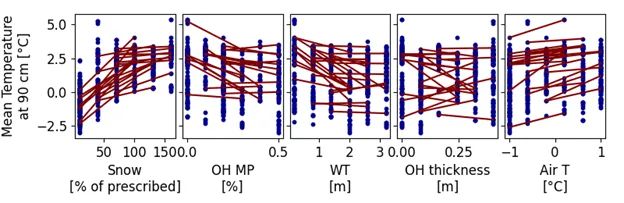
Mean annual soil temperature at 90 cm depth plotted against the normalized snow precipitation, O-horizon macroporosity, water table depth, O-horizon thickness, and air temperature factor values for each model run (blue dots). In each subplot, the red lines link two runs associated by a change in the factor and represent the corresponding change in soil temperature.
For more information, please contact:
Ian Shirley