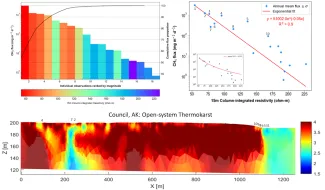
Analysis of CH4 emissions derived alongside geophysical electrical resistivity measurements revealed that localized hot spots of CH4 (>500 mg m2 d-1) were observed in two study site locations.
Terrestrial wetland emissions are the largest single source of greenhouse gas CH4. Since soil resistivity (Ω-m) and anaerobic CH4 production are dependent on temperature and water table position (i.e., the ion-mobility), the team hypothesized that resistivity and methanogenesis are correlated. The team used geophysical surveys to demarcate the presence or absence of permafrost, and couple CH4 emissions atop thermokarst (TK) talik geometry. The team reported a CH4 flux inventory (n = 610) from a watershed near Fairbanks, Alaska, and the Seward Peninsula in Council, Alaska, from 2019 to 2022. The team computed and plotted CH4 flux emissions atop soil resistivity. Methane trends were found to be spatially related to talik geometry along boundaries of permafrost-TK transitions. As soil resistivity decreases and becomes supersaturated, CH4 flux increases exponentially. In thawed soils (<200 Ω-m), the team found that for roughly every 45 Ω-m decrease, CH4 flux increased by an order of magnitude. The CH4 emissions followed exponential growth and were inversely related to electrical resistivity at Fairbanks (y = 1,901.3e-0.016x, R2 = 0.87) and Council (y= 51,002.0e-0.05x, R2 = 0.9) sites. Analysis revealed that hot spots of CH4 (>500 mg m2 d-1) dominated both study area budgets, representing 90% of the flux inventory but sourced from only 15% of total observations. Methane hot spots ranged from 506 to 23,447 mg m2 d-1 (N = 79) and were most frequent along TK escarpments between low-wetlands and dry-uplands. Geophysical surveys (VLF, ERT) revealed that hot spots of CH4 were associated with the lowest resistivity (e.g., 5–20 Ω), showing the influence of water table position. Methane hot spots, which comprised 90% of total emissions, persisted in both cold and growing seasons. Radiocarbon dating of a winter CH4 hot spot revealed a 14C age of 35,360 YBP (δ13C −73.8 ‰) corresponding to 14 m of thaw. The winter mean flux of 212 ± 15 mg CH4 m2 d-1 (~40% of annual emissions) resembled summer emissions from other ecosystems. The mean summer flux of 1,151 ± 18 mg CH4 m2 d-1 is much higher than 105 prior investigations in other permafrost ecosystems. This study found the key drivers for CH4 hot spots to be (1) topographic relief boundaries of TK, (2) water table position, (3) subsurface hydraulic connectivity, and (4) wetland geomorphology. This finding alludes to the important influence of hydrology on soil biogeochemistry


