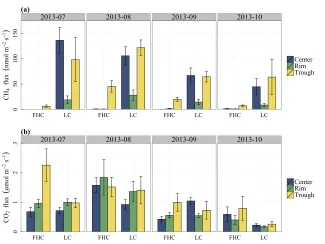
In a manuscript recently published in Global Change Biology, LBNL researchers Lydia Smith Vaughn, Mark Conrad, Markus Bill, and Margaret Torn present results of a two-year field methane study in the Barrow Environmental Observatory. Using measurements of surface methane and CO2 fluxes, concentrations and stable isotope compositions of methane and DIC at 3 depths in the soil, and soil moisture and temperature, this study identifies important predictors of methane emissions and microbial methane production pathway across a range of polygon types and features representing varying degrees of permafrost degradation. Averaged across all polygon features (centers, rims, and troughs), methane emissions from low-centered polygons were ~9 times as high as from flat- and high-centered polygons. While this pattern in methane emissions followed an overall soil moisture gradient, statistical results indicate that methane emissions depend on microtopographic position and polygon type to a greater degree than soil moisture could explain. Specifically, low-centered polygons with intact ice wedges had higher methane emissions, a greater contribution of acetate cleavage to methane production, and lower methane oxidation than did flat- and high-centered polygons. This relationship persisted even in the relatively dry rims of low-centered polygons and the saturated troughs of flat- and high-centered polygons. In contrast with many previous studies, these findings document a mechanism whereby loss of subsurface ice can lead to local decreases in tundra methane emissions.
Reference:
Vaughn LJS, ME Conrad, M Bill, and MS Torn. 2016. Isotopic insights into methane production, oxidation, and emissions in Arctic polygon tundra. Global Change Biology 22: 3487-3502. http://dx.doi.org/10.1111/gcb.13281
[[{"fid":"239","view_mode":"default","type":"media","link_text":null,"fields":{},"attributes":{"height":"3000","width":"3992","style":"width: 800px; height: 601px;","class":"media-element file-default"}}]]
Figure 6. Greenhouse gas emissions, classified by polygon type, position, and measurement month. (a) Net CH4 flux in nmol CH4 m-2 s-1 and (b) ecosystem respiration in mol CO2 m-2 s-1 were measured from each feature of 4 flat/high-centered (FHC) and 3 low-centered (LC) polygons. Standard errors were calculated from field replicates.
For more information, please contact:
Lydia Vaughn
lydiajsmith@lbl.gov

