
Integrating geophysics with topographic and multispectral data into a machine learning classifier is a promising approach for mapping the distribution of near-surface permafrost in regions of discontinuous permafrost.
Permafrost soils are a critical component of the global carbon cycle because they store large amounts of carbon. They are also important on regional and local scales, in part because they regulate the hydrologic flux from uplands to rivers and oceans. Furthermore, on a local scale, degradation of permafrost soils can cause land surface subsidence, which can severely damage infrastructure that is critically important for local communities. Therefore, identifying the distribution of permafrost soils is crucial to understanding local- to global-scale effects of permafrost thaw. Regional and hemispherical maps of permafrost distributions are typically generated at the scale of tens of meters or kilometers. Although these maps are useful for assessing the potential global effects of permafrost thaw, the products are too coarse to resolve permafrost distributions at a scale relevant to infrastructure stability or to identify the feedback processes driving permafrost degradation. The team trained an extremely randomized trees machine learning classifier to generate meter-scale maps of permafrost distributions in the discontinuous permafrost region on the Seward Peninsula, Alaska. The team identified permafrost distributions in three watersheds using measurements of soil temperature at 0.75 m depth, electrical resistivity tomography, and observations from soil pits and frost probing. Then, the team trained the model to predict permafrost distributions using the ground-truth data, topographic and vegetation metrics derived from lidar point clouds, and multispectral indices for snow cover and vegetation derived from high-resolution satellite imagery from two sites, Teller 27 and Teller 47 (Figure 9A and 9B, respectively). The model predicted permafrost distributions with ~90% accuracy at Teller 27 and Teller 47, and predicted permafrost distributions with 70% accuracy at the third test site, Kougarok Hillslope (Figure 9C). These results demonstrate that integrating geophysical measurements with topographic and multispectral data into a machine learning model is a promising approach to generating fine-scale maps of permafrost distributions.
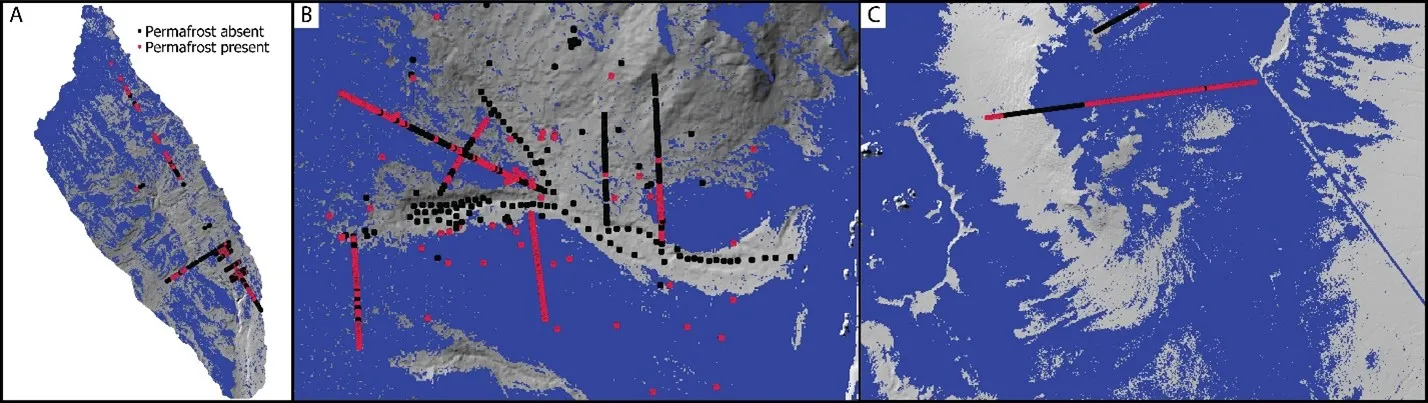
The predicted permafrost extent (blue pixels) at (A) Teller 27, (B) Teller 47, and (C) Kougarok Hillslope on the Seward Peninsula in Alaska. The points indicate the ground-truth data generated from measurements of temperature, electrical resistivity, and frost probe depth to refusal. Black points indicate points without near-surface permafrost, and red points mark locations with near-surface permafrost. The model, which was trained using data from Teller 27 and Teller 47, predicted permafrost distribution with 93% accuracy for Teller 27 and 95% accuracy for Teller 47. The trained model predicted permafrost with 70% accuracy at Kougarok.
For more information, please contact:
Evan Thaler