
A new algorithm was developed to generate high–spatiotemporal resolution estimates of snow-covered area using commercial satellite imagery.
The extent and duration of snow cover, a critical component of the hydrologic cycle and the global climate system, are expected to shift dramatically under climate change. Developing high-resolution assessments of snow cover change is crucial for estimating the effect of changing snow cover on the hydrologic system and understanding other fundamental processes, such as snow–vegetation and snow–permafrost feedbacks. Remote sensing tools allow for powerful methods for mapping snow-covered area (SCA) across a landscape. The most common method for estimating SCA uses the normalized difference snow index, which relies on spectral measurements in the shortwave-infrared (SWIR) wavelengths. The index can effectively estimate catchment- to regional-scale SCA but not fine-scale SCA because of current limitations on the resolution of satellite-derived SWIR measurements. The team mapped SCA using only a threshold of blue wavelengths and high-resolution satellite imagery. This thresholding method, the Blue Snow Threshold algorithm (BST), has previously been used with digital camera imagery. The team refined and automated the algorithm for use with cloud-free, high-resolution satellite imagery and found that the BST can be used to assess fine-scale SCA. For validation, the team compared BST-derived estimates of SCA to airborne lidar surveys, Landsat fractional SCA, and snow disappearance dates from Snow Telemetry (SNOTEL) stations. The BST-predicted SCAs had F-scores between 0.81 and 0.94 in four study areas in California and Colorado. The team also found general agreement between SCA and snow disappearance at multiple SNOTEL sites across the western United States. Given the relatively recent availability of high-resolution satellite imagery with spectral measurements in the visible wavelengths (and lacking measurements in the SWIR wavelengths), the BST offers a reliable and easy-to-apply tool for examining fine-scale snow-related processes.
Citation: Thaler, E. A., R. L. Crumley, and K. E. Bennett. 2023 (available online 2022). “Estimating snow cover from high-resolution satellite imagery by thresholding blue wavelengths.” Remote Sensing of Environment 285: 113403. https://doi.org/10.1016/j.rse.2022.113403.
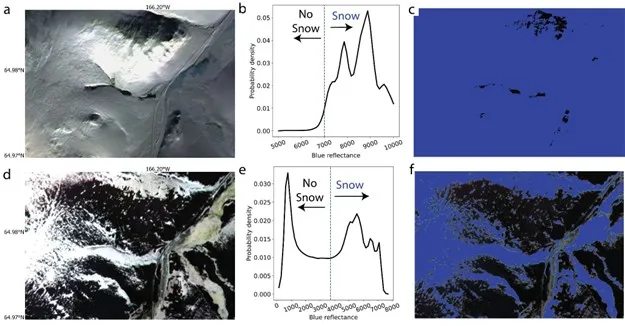
Examples of threshold selection for binary classification of pixels using the BST. (a) PlanetScope true-color satellite image (primarily composed of snow-covered pixels) of a location on the Seward Peninsula acquired on March 4, 2020, (b) the distribution of its values, and (c) the snow mask generated from the BST, in which blue areas indicate pixels classified as snow. This image contains 8,600 pixels, which exceeds the mean value defined by the algorithm for mixed snow/non-snow images; therefore, the threshold (t), shown as the blue dashed line, is set to the fixed value of 7,000 pixels. Values greater than the threshold are considered snow, whereas values less than the threshold are non-snow pixels. (d) PlanetScope true-color satellite image of a location on the Seward Peninsula acquired on May 5, 2020, (e) the smoothed distribution of its values with t = 3,700 pixels shown as the blue dashed line, and (f) the snow mask generated from the BST.
For more information, please contact:
Evan Thaler