
Coincident monitoring of the spatiotemporal distribution and interaction between land, soil, and permafrost properties is important for advancing our understanding of ecosystem dynamic. In this study, Baptiste Dafflon (LBNL) developed and applied a novel monitoring strategy in a coastal tundra site near Barrow, AK. The goal was to quantify complex Arctic ecosystem responses to freeze-thaw process. The strategy included autonomous: electrical resistivity tomography (ERT) to monitor soil properties, optical cameras mounted on a pole to monitor vegetation dynamics, and point probes to measure soil temperature. Periodic manual measurements included thaw layer thickness, snow thickness, and dielectric permittivity. According to Baptiste, the dense monitoring dataset revealed several insights about tundra system freeze-thaw behavior. In the active layer, soil electrical conductivity (a proxy for soil water content) indicated an increasing correlation with the green chromatic coordinate (a proxy for vegetation vigor) over the growing season, with a peak correlation (R=0.89) on July 22, near the typical height of the growing season. Soil conductivity and green chromatic coordinate also revealed significant positive correlations with thaw depth, which is influenced by soil and surface properties. In permafrost, the soil electrical conductivity revealed annual variations in solute concentration and unfrozen water content, including dynamics at temperatures well below zero in saline permafrost. These findings may have implications for long-term thaw in Coastal permafrost regions. Baptiste explained that this is the first time that above- and below-ground geophysical monitoring approaches have been deployed within an Arctic ecosystem. The results illustrate the autonomous systems have significant potential to remotely ‘visualize’ soil and vegetation ecosystem dynamics and their interactions - in high resolution yet over field relevant scales.
[[{"fid":"177","view_mode":"default","type":"media","link_text":null,"attributes":{"title":"Figure. a) Correlation and normalized mean absolute error between bulk electrical conductivity (in top 20 cm soil) and green chromatic coordinate from July 1 (day 0) to August 11 (day 40) 2014 (using 72 locations along a 35 m long transect crossing var","height":"354","width":"1160","class":"media-element file-default"}}]]
Figure 1. a) Correlation and normalized mean absolute error between bulk electrical conductivity (in top 20 cm soil) and green chromatic coordinate from July 1 (day 0) to August 11 (day 40) 2014 (using 72 locations along a 35 m long transect crossing various polygon types). b) Linear relationship between green chromatic coordinate and bulk electrical conductivity on July 22 2014 with black lines indicating the relationship ± 2 times the standard deviation of the residual distribution (r = 0.89). c) Cross-correlation between electrical conductivity and green chromatic coordinate (black line indicate the 0 day time lag of one relatively to the other) showing that green chromatic coordinate values around July 22 (July 20 to 25) correlate best with electrical conductivity values at similar times but also at different times mainly because electrical conductivity values are more strongly auto-correlated over time than green chromatic coordinate.
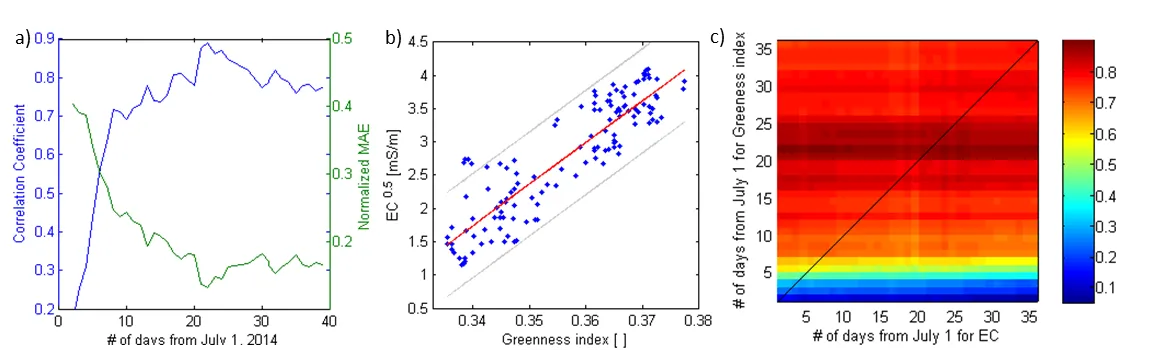
Figure 1. a) Correlation and normalized mean absolute error between bulk electrical conductivity (in top 20 cm soil) and green chromatic coordinate from July 1 (day 0) to August 11 (day 40) 2014 (using 72 locations along a 35 m long transect crossing various polygon types). b) Linear relationship b
For more information, please contact:
Baptiste Dafflon
bdafflon@lbl.gov